Installation
- Download the package on github
- Read and follow the instructions of README and INSTALL files. Installation is usually quite simple and some commands are enough for a standard installation of the tool.
- On UNIX or Mac platforms:
- tar xvfz thepackage.tar.gz
- cd theMainDirectory
- ./configure
- make
- make install
Presentation
gnuplot is a software for representing graphically data set and/or functions in either 2D or 3D. It works in interactive mode or takes a command file as argument.
Simple Plotting
Start gnuplot and then type in commands
[user@machine]$ gnuplot

        G N U P L O T
        Version 3.7 patchlevel 3
        last modified Thu Dec 12 13:00:00 GMT 2002
        System: Linux 2.6.8.1-10mdk

        Copyright(C) 1986 - 1993, 1998 - 2002
        Thomas Williams, Colin Kelley and many others

        Type `help` to access the on-line reference manual
        The gnuplot FAQ is available from
        http://www.gnuplot.info/gnuplot-faq.html

        Send comments and requests for help to
        Send bugs, suggestions and mods to


Terminal type set to 'x11'
gnuplot>
The last line informs the user that the output will be the a X11 window (unix/mac systems). If we want to visualize the graphics corresponding to the data of the file demo-gnuplot.data, you just have to launch gnuplot and then type in the command plot followed by the name of the data file surrounded by simple quotes:
gnuplot> plot 'demo-gnuplot.data'
Changing the display of the graphics
The result is displayed in a window (Figure 1). By default, each data record is represented as a point and points are not linked. You can ask for a display that link points with lines (Figure 2), steps (Figure 3) or impulses (Figure 4) according to your needs. All these possibilities are described in the online help, obtained by the command help with.
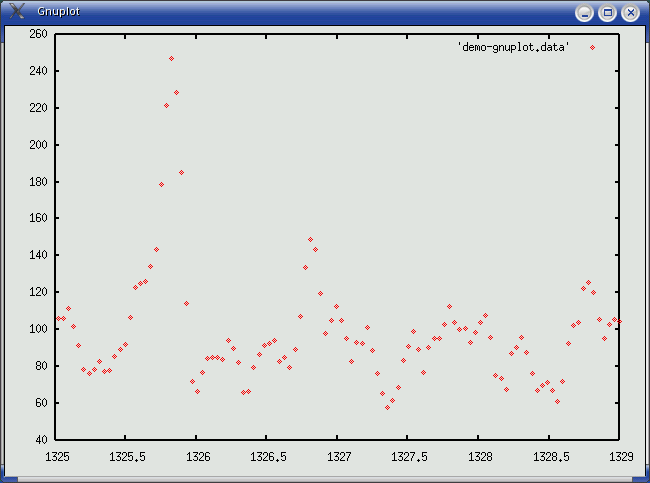
Figure 1: plot 'demo-gnuplot.data'
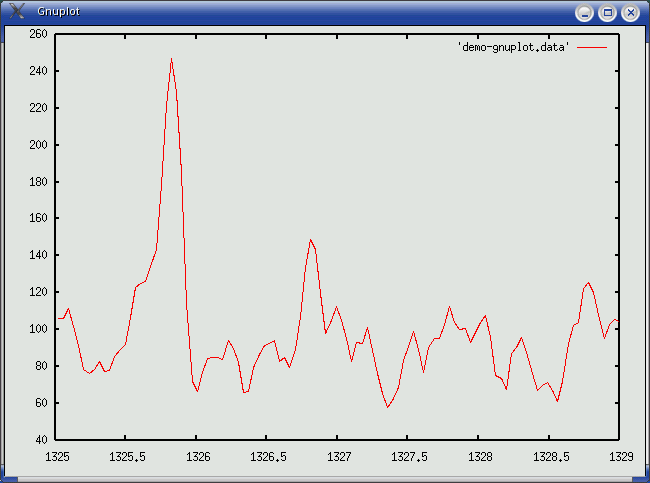
Figure 2: plot 'demo-gnuplot.data' with lines
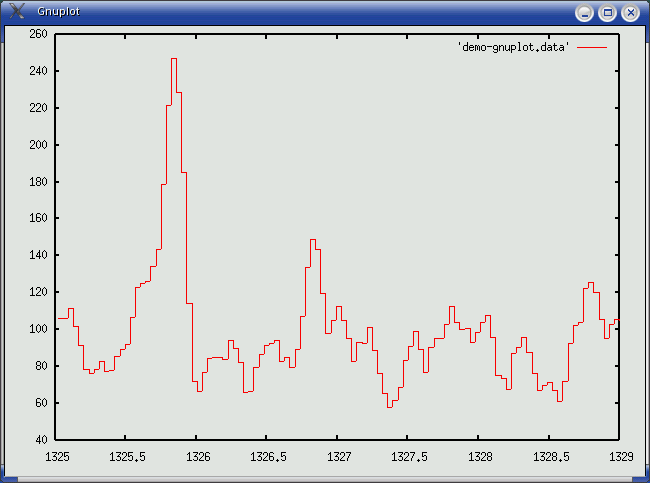
Figure 3: plot 'demo-gnuplot.data' with steps
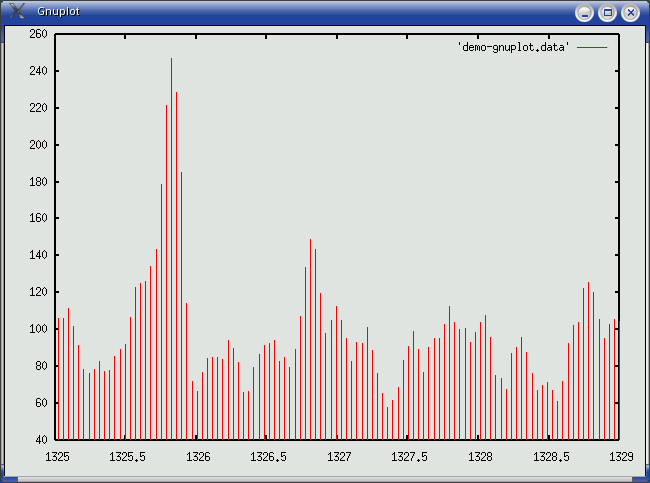
Figure 4: plot 'demo-gnuplot.data' with impulses
Coordinates of points
When your data file is composed of more than one column, you can choose to plot the second column according to the first one for instance. In that case each point drawn will use the first column as its x value and the second as its y value.
plot 'data3' using 1:2 w l, 'data3' using 1:3 w l, 'data3' using 1:4 with linesYou can get the data3 file for testing it.

Figure 4bis: using two columns for plotting the data
Changing the x and y ranges
It is sometimes necessary to modify the range of x and y values, for instance for zooming on a particular region or for the legend to be more visible. You can use the set xrange [interval] or set yrange for that:
set xrange[100:200] ; set yrange[0:900]
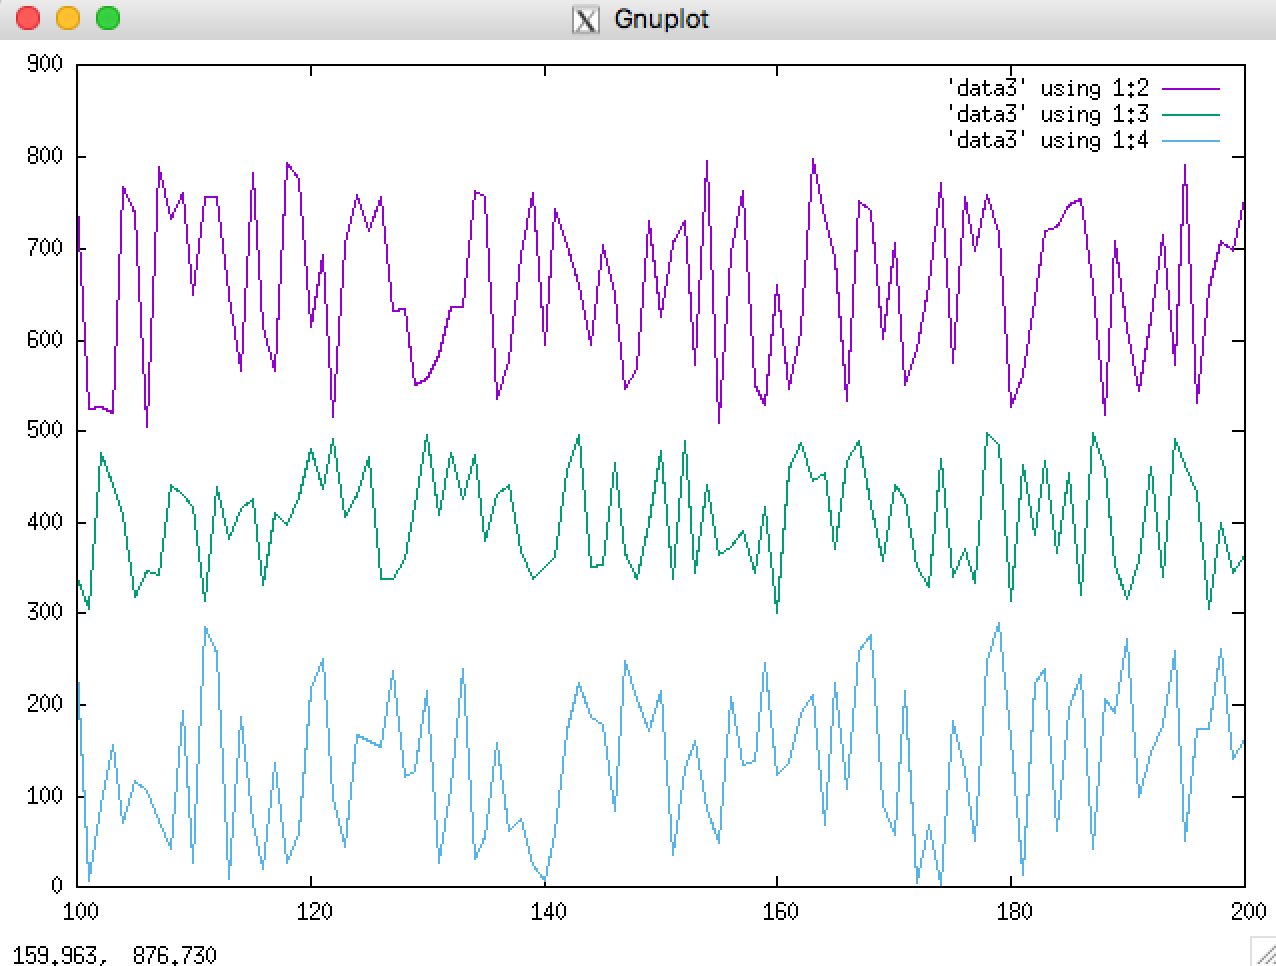
Figure 4ter: using range for zooming or enlarging the display
Labels and Titles
It is also possible to add some information on the graphics, we can for instance:
- add a grid for a better reading of the values: set grid;
- add a label on the x/y axes: set xlabel "poids moleculaire" set ylabel "volume"
  gnuplot> plot 'demo-gnuplot.data' with lines
  gnuplot> set grid
  gnuplot> set xlabel "poids moleculaires"; set ylabel "volumes"
  gnuplot> replot

Figure 5: with labels and a grid
For adding titles:
set title "my title located top/centered"If you want to name the graphics with another title than the name of the data file (as it is used by default), you should end the plot command with title "my title" or if you want to remove all titles: title notitle
plot 'data1' using 3:4 with lines title "super curve", 'data2' using 2:3 w steps title notitle
You can also put some information directly within the graph for highlighting something by set label myLabel "the content of the label" at x,y justification (left/right/center). For removing the label just use the identifier of the label: set nolabel myLabel
  gnuplot> set nogrid
  gnuplot> set label 24 "< -- 247.024" at 1325.85,247 left
  gnuplot> replot

Figure 6: addition of annotations within the graphics
Producing images
Using gnuplot it is possible to produce images directly. For that it is necessary to inform gnuplot of the type of images we want to produce by providing it the output type (png for instance) and output file (image.png for instance).
set grid;
set xlabel "poids moleculaires";
set ylabel "volumes";
set terminal png;
set output 'demo2.png';
plot 'demo-gnuplot.data2' with impulses
It may happen that the display is not strictly identical according on the terminal (x11 window of image file), as illustrated by Figures 7 and 8. The data file used for producing the graphics is demo-gnuplot.data2.
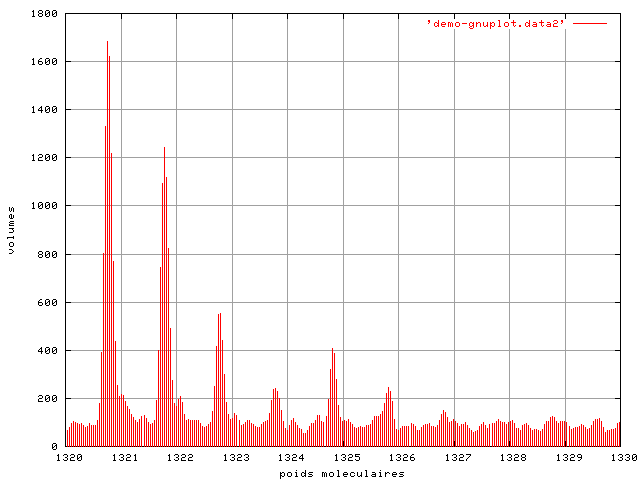
Figure 7: the png image produced from the command file

Non Interactive Mode
In non-interactive mode we use a file containing the commands that will be executed by the gnuplot interpreter. For instance, the file grid_n_labels.gnp (below) produces what was on Figure 5.
  set grid;
  set xlabel "poids moleculaires";
  set ylabel "volumes";
  plot 'demo-gnuplot.data' with lines
If we want a window to stay opened, it requires the parameter -persist:
[user@machine]$ gnuplot -persist grid_n_labels.gnp
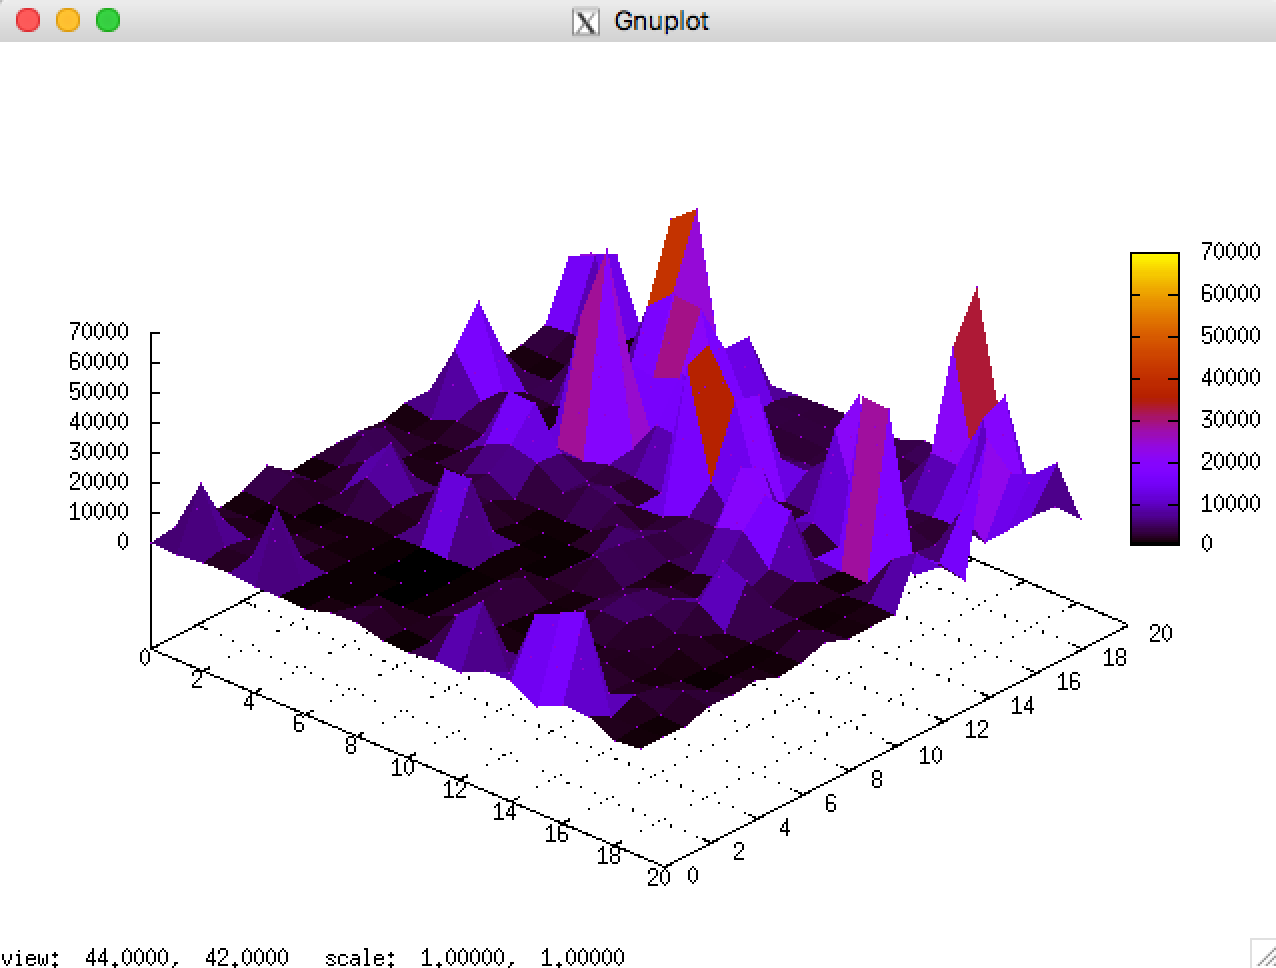
3D representation of data
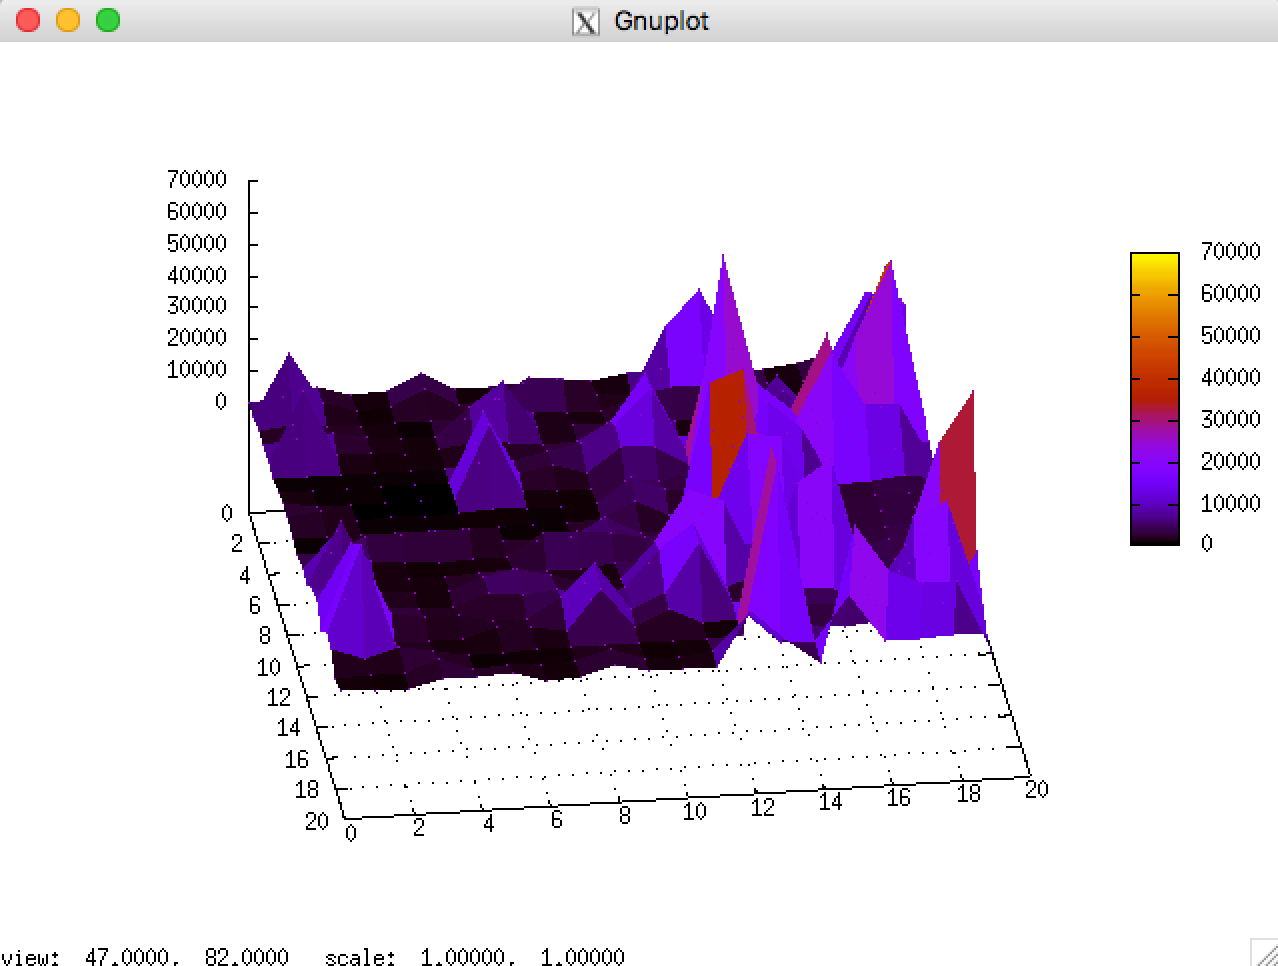
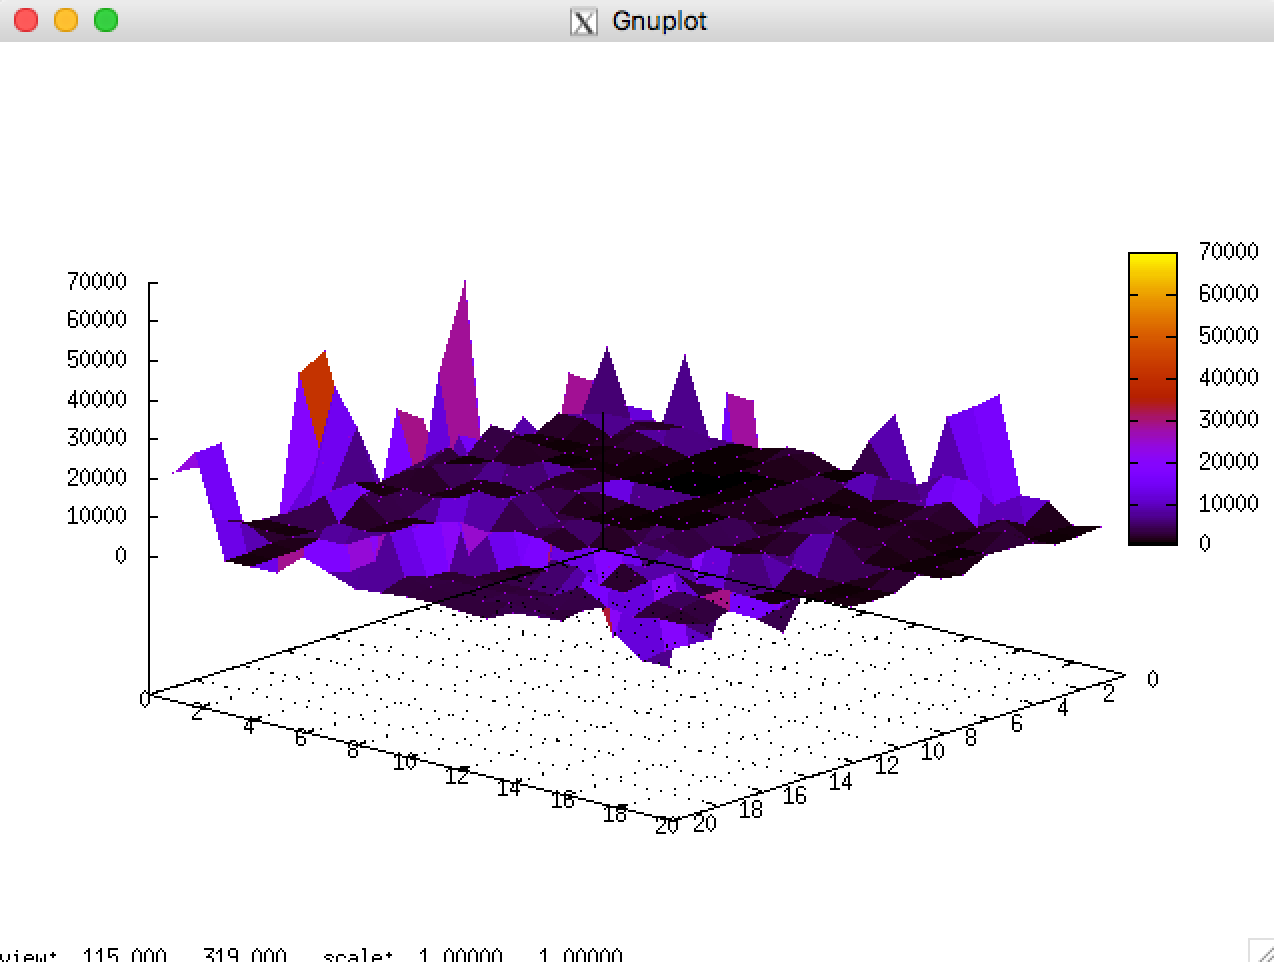
For visualizing data in 3D, instead of using plot it is necessary to use splot and matrix if the data has such a format. for instance for data3d data file, the following commands produce the 3D graphics of Figure 9.
  set grid
  set pm3d
  set title "Nombre de fourmis qui se baladent sur les sommets"
  splot "3-partitions-distrib_1" matrix with dots notitle
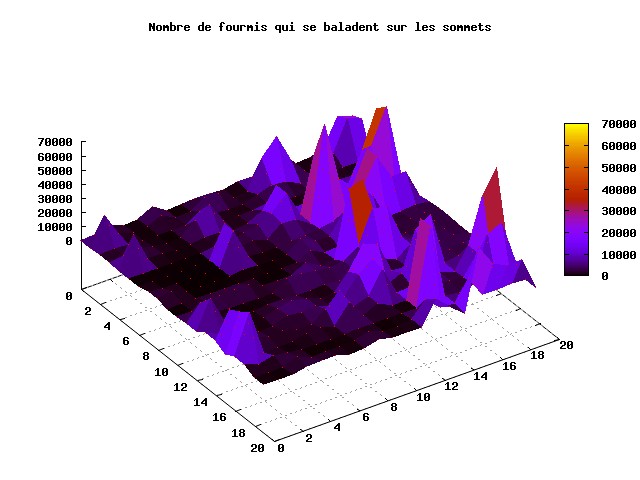
When displayed in the window, it is possible to move the graphics in several directions using the mouse
References